.svg)





B2B Returns and Claims Processing: Time and Cost Benchmarks 2026
B2B returns and claims processing takes 7–21 days on average and costs 3–5x more per transaction than the original order. Most operations leaders know their order processing cost; almost none track their returns processing cost with the same discipline. This post benchmarks returns and claims processing in 2026, explains what drives the cost, and shows the connection to order accuracy upstream.
B2B returns take 7–21 days to process and cost 3–5x more per transaction than the original order. Most operations leaders can quote their cost per order. Almost none track their returns processing cost with the same discipline. The gap between those two numbers is where working capital accumulates and customer relationships erode. This post benchmarks the full returns and claims processing cycle in 2026 and connects upstream order accuracy directly to downstream returns volume.
Table of Content
- B2B Returns Take 7–21 Days to Process: The Credit Note Backlog Most Finance Teams Normalize
- Claims Processing Costs 3–5x More Than the Original Order Processing
- Returns Volume Correlates Directly With Order Accuracy Rate: Wrong Orders Are the Root Cause
- Automated Returns Processing Reduces Credit Cycle From 3 Weeks to 3 Days
- Frequently Asked Questions
- What is the average returns processing time for B2B manufacturers in 2026?
- How much does B2B returns and claims processing cost compared to order processing?
- How do B2B manufacturers reduce returns processing cycle time?
- What is the connection between order accuracy rate and returns volume in B2B manufacturing?
- How do B2B distributors reduce the cost of claims processing without adding finance headcount?
B2B Returns Take 7–21 Days to Process: The Credit Note Backlog Most Finance Teams Normalize
What the Returns Processing Workflow Actually Contains: Authorization, Inspection, Credit, and Reconciliation
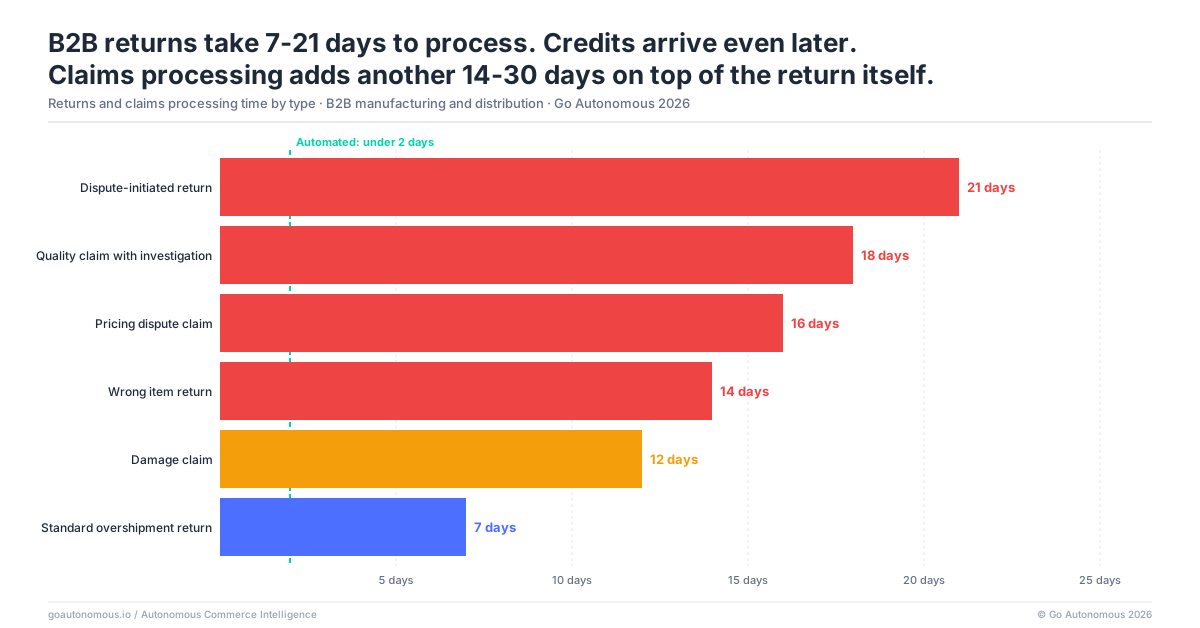
The B2B returns processing cycle is long because it contains multiple sequential steps, each with its own queue time. A customer requests a return. The supplier issues a Return Material Authorization (RMA). Goods are shipped back. The receiving team inspects and confirms condition. The credit note is issued. The ERP is updated. The original order is reconciled. None of these steps runs in parallel by default in manual operations.
Benchmarks by step in a standard manual environment:
- RMA issuance: 3–5 days
- Goods receipt and inspection confirmation: 2–4 days
- Credit note creation in finance: 3–7 days
- ERP reconciliation and customer communication: 1–3 days
Total cycle: 7–21 days for standard returns. Complex claims involving disputed liability or partial credits extend that range further. The 21-day figure is not a worst case — it is the median in operations that have not measured or optimized the workflow.
Why Finance Normalizes Long Returns Cycles and What That Normalization Costs
Finance teams that operate with 14-day credit cycles treat the delay as structural. The credit backlog is reconciled at month-end, customers are informed that credits take 2–3 weeks, and the workflow continues unchanged. The normalization is expensive in ways that do not appear directly on any cost report.
In B2B, where a single return may represent €50,000–500,000 in working capital tied up pending credit resolution, the cost of the delay is a direct working capital cost. A supplier carrying 30 open returns at any time — each averaging €80,000 and each taking 14 days to credit — is managing €2.4 million in working capital tied to process delay, not to legitimate disputes. The efficiency gains from compressing that cycle are not marginal improvements; they are balance sheet improvements.
Each time we added one or two million euros in revenue, we had to add another operator. From a cost perspective, that's an unsustainable way of operating a business.

Claims Processing Costs 3–5x More Than the Original Order Processing
What a Claim Actually Is: The Taxonomy of Disputes, Shortages, and Damage Claims
A claim is not a simple return. Claims arise from four primary scenarios: wrong product delivered, short shipment, damaged goods on arrival, and pricing disputes. Each has a different investigation path, a different evidence requirement, and a different resolution type. Wrong product claims require cross-referencing the original order line against the shipment manifest. Short shipment claims require proof of delivery and warehouse dispatch records. Damage claims require photographic evidence, carrier documentation, and liability determination. Pricing disputes require contract review and approval authority.
The taxonomy matters because each claim type requires different skills, different data access, and different decision authority. A team optimized for one claim type is not automatically effective across all four. Multi-type claims — a shipment that is both short and contains a damaged item — require coordination between teams, adding further cycle time.
Why Claims Require More Labor Than Orders Despite Involving Fewer Line Items
A standard B2B order follows a defined path: receive, validate, enter, confirm. The path is linear. A claim requires investigation before any resolution step is possible. Someone must pull the original order, the shipment documentation, the proof of delivery, and the customer’s evidence. Someone must make a judgment call about liability — and liability determination requires seniority that standard order processing does not. Someone must decide on the remedy: replacement, full credit, or partial credit. Someone must update the ERP, communicate the resolution, and close the claim in the system.
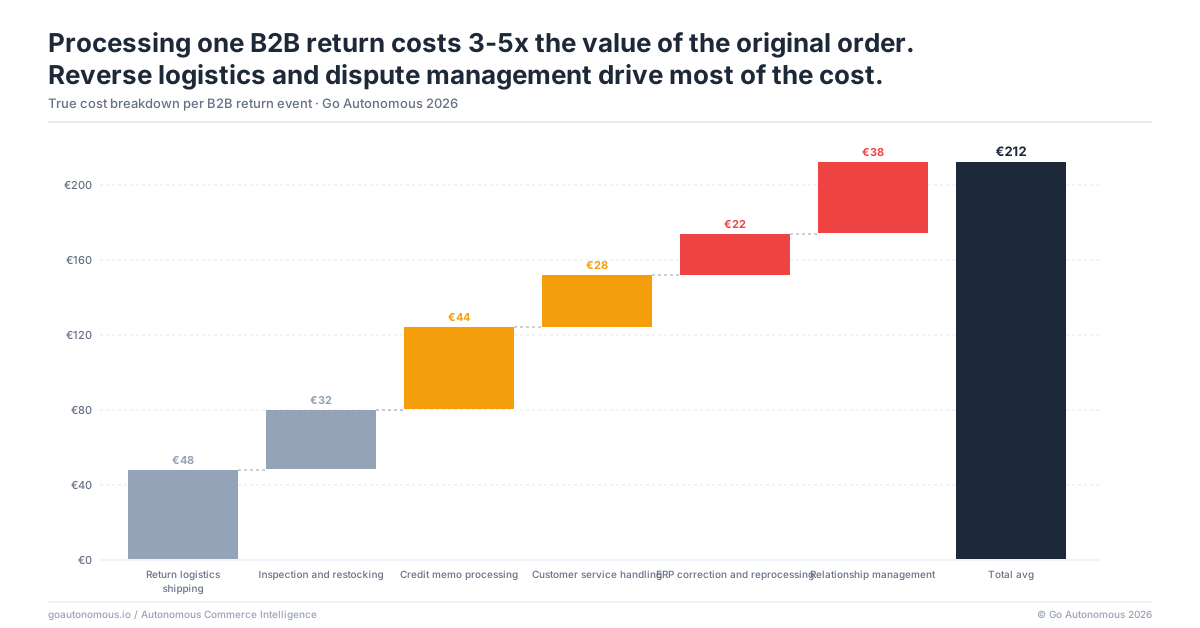
Three to five people may touch a single complex claim before it closes. The total labor cost runs 3–5x the original order processing cost. When manual order processing costs €15–35 per transaction, a claims resolution may cost €60–175 per incident — before accounting for the cost of the original wrong shipment itself. The operational equation that Mikkel Vindeløv describes at Hempel applies directly: each increment of revenue that generates claims without process improvement adds unsustainable overhead. Operations that run 1–3% claims rates on high-volume B2B order books carry significant hidden labor costs that never appear on the order processing cost line.
Returns Volume Correlates Directly With Order Accuracy Rate: Wrong Orders Are the Root Cause
The Returns Rate Benchmark: What It Looks Like at 92% vs 98% Order Accuracy
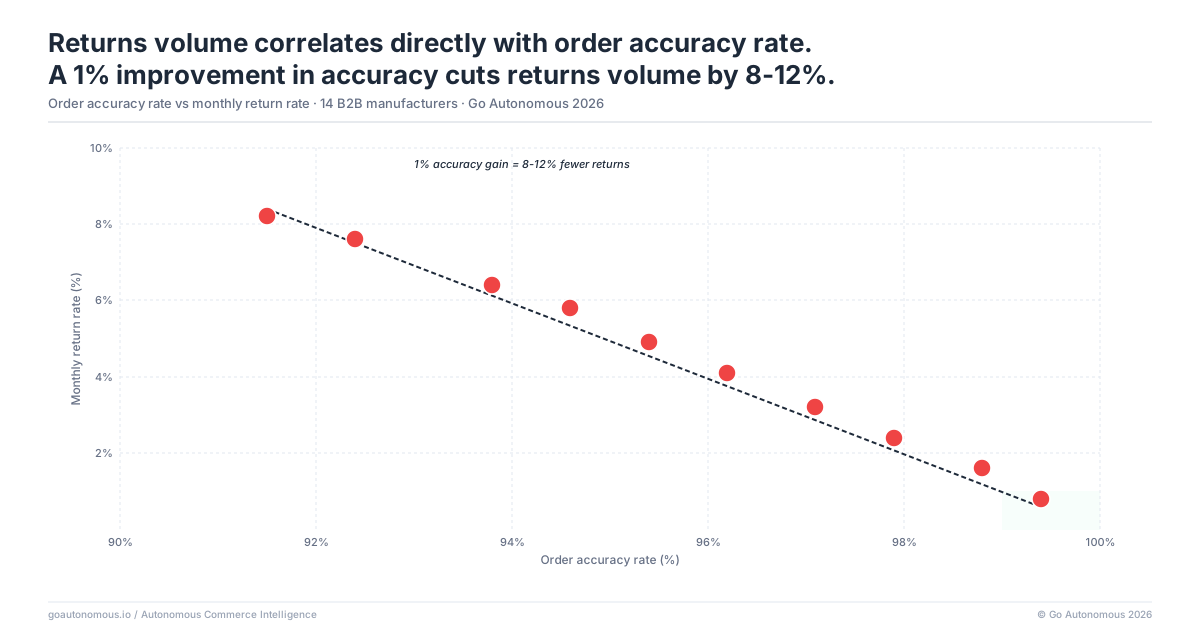
Order accuracy rate is the primary upstream driver of returns volume. Operations running 92% order accuracy generate roughly 3x the returns volume of operations running 98% accuracy — not because returns processes differ, but because the number of wrong orders entering the fulfillment pipeline differs by 6 percentage points. At 500 orders per day, the difference between 92% and 98% accuracy is 30 wrong orders daily versus 10. Each wrong order is a returns candidate. Each return candidate that becomes an actual return enters the 7–21 day processing cycle at a 3–5x cost multiplier.
The B2B accuracy benchmark in 2026: operations with fully autonomous order intake report 98–99% first-time-right rates. Operations relying on manual email processing report 88–94% accuracy. The gap is structural: human order entry introduces interpretation errors, master data mismatches, and product reference confusion that rule-based automation cannot fully eliminate. Industry benchmarks show rule-based automation plateaus at approximately 60% touchless — the remaining 40% either requires human intervention or passes through with errors that surface downstream as returns and claims.
The Cascade: How One Percentage Point of Order Accuracy Improvement Reduces Returns Volume
At 500 orders per day, improving order accuracy by 1 percentage point eliminates 5 wrong orders daily. If 60% of wrong orders result in a return (the remaining 40% are corrected before shipment), the improvement eliminates 3 returns per day. At a returns processing cost of €60–175 per return, that 1 percentage point improvement generates €180–525 daily in avoided returns processing costs — €65,000–190,000 annually from a single percentage point of accuracy improvement.
The upstream prevention ROI almost always exceeds the returns processing optimization ROI. Investing in returns workflow efficiency while leaving order accuracy unchanged is equivalent to treating symptoms while leaving the root cause unaddressed. The autonomous commerce approach targets accuracy at point of entry: orders are validated against ERP master data before confirmation, wrong product references are caught before shipment, and the returns-generating error rate drops structurally rather than through downstream workflow improvement.
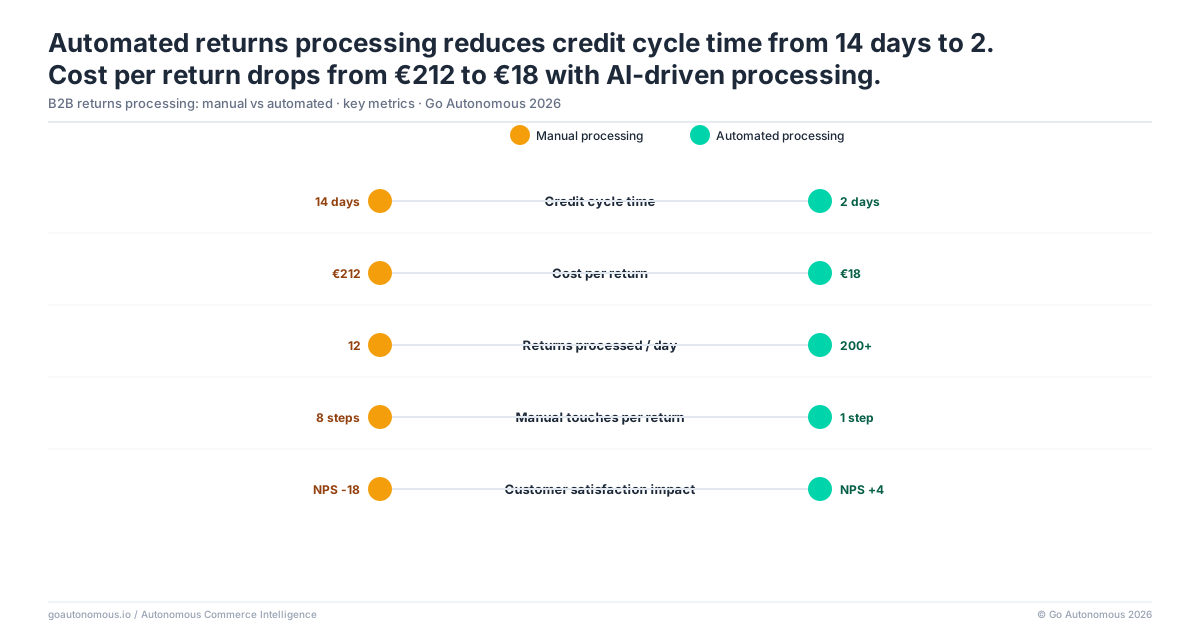
Automated Returns Processing Reduces Credit Cycle From 3 Weeks to 3 Days
How AI-Assisted Returns Processing Accelerates Each Step of the Cycle
Automating returns processing requires two parallel improvements: reducing wrong orders at the source and accelerating the returns workflow for the returns that do occur. The first improvement is structural — autonomous order intake that validates before entry eliminates the wrong orders that generate returns. The second improvement is operational — AI that reads incoming return requests, cross-references the original order, identifies the return type, issues the RMA automatically for standard return scenarios, and creates the credit note in the ERP once return receipt is confirmed.
Step-by-step acceleration in an automated returns environment:
- Return request received and classified: automated, under 5 minutes
- Original order cross-referenced and return type identified: automated, under 10 minutes
- RMA created in ERP for standard return scenarios: automated, same day
- Credit note created upon confirmed receipt: automated, same day as receipt confirmation
Credit cycle time drops from 3 weeks to 3 days for standard returns. Complex claims requiring liability determination remain human-reviewed — but they represent a small fraction of total returns volume once the standard return pathway is automated. The result is that the finance team’s returns workload shrinks to genuine exceptions rather than routine authorization and credit creation.
What Finance Operations Look Like When the Credit Backlog Shrinks to Near-Zero
Finance teams in automated returns environments report three structural changes: quarter-end credit backlogs effectively disappear because returns are processed continuously rather than batched; customer accounts payable teams stop escalating credit disputes because credits arrive within days of confirmed return receipt; and the finance team’s returns-related workload shifts from administrative processing to exception management and customer dispute resolution on genuinely complex cases.
The working capital impact is direct. Carrying €2.4 million in outstanding returns credits because of process delay costs money. Compressing the cycle to 3 days releases that working capital continuously rather than at month-end. See the full picture at the success cases and the architecture overview at autonomous commerce. For manufacturers and distributors ready to benchmark their returns cost and model the improvement case, book a session with the Go Autonomous team.
Frequently Asked Questions
What is the average returns processing time for B2B manufacturers in 2026?
B2B returns processing takes 7–21 days on average in manual environments. The cycle covers return request, RMA issuance (3–5 days), goods receipt and inspection (2–4 days), credit note creation in finance (3–7 days), and ERP reconciliation (1–3 days). Operations with automated returns intake reduce this to 3–5 days for standard returns.
How much does B2B returns and claims processing cost compared to order processing?
Claims and returns processing costs 3–5x more per transaction than the original order processing. When manual order processing costs €15–35 per order, a single claims resolution may cost €60–175 per incident. This is because claims require investigation, liability determination, remedy decisions, and multi-team coordination that standard order processing does not.
How do B2B manufacturers reduce returns processing cycle time?
Two parallel improvements reduce returns cycle time: improving order accuracy upstream to reduce the volume of wrong orders that generate returns, and automating the returns workflow itself. AI-assisted returns processing reads return requests, cross-references original orders, creates RMAs automatically for standard scenarios, and issues credit notes upon confirmed receipt — compressing the 3-week cycle to 3 days.
What is the connection between order accuracy rate and returns volume in B2B manufacturing?
Returns volume correlates directly with order accuracy rate. Operations at 92% order accuracy generate approximately 3x the returns volume of operations at 98% accuracy. Improving accuracy by 1 percentage point at 500 orders per day eliminates 5 wrong orders daily — potentially saving €65,000–190,000 annually in avoided returns processing costs, excluding the cost of the wrong shipments themselves.
How do B2B distributors reduce the cost of claims processing without adding finance headcount?
B2B distributors reduce claims processing cost by automating the standard return pathway — RMA creation, receipt confirmation, and credit note issuance — so the finance team handles only genuine exceptions. This shifts the workload from administrative processing (which scales with volume) to exception management (which scales with complexity). The result is lower cost per return and no headcount increase as returns volume grows.