.svg)





B2B Order Automation ROI: What Manufacturers Report After 12 Months
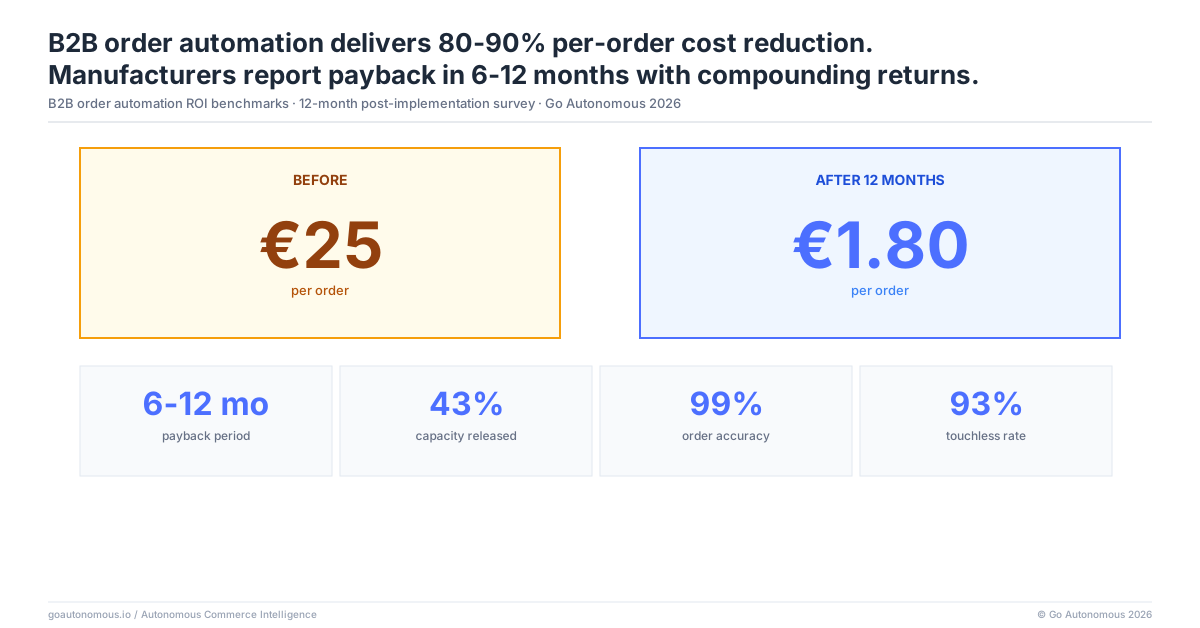
B2B manufacturers deploying autonomous order processing report 80–90% reductions in per-order cost within the first 12 months. The ROI case is not primarily about headcount reduction — it is about capacity liberation, error elimination, and the ability to scale revenue without scaling operations. This post benchmarks what manufacturers actually report after 12 months of autonomous order processing.
B2B manufacturers running 500 orders per day at €20 average per-order cost carry an annual processing bill of €2.5M. Autonomous order processing brings that cost below €2 per order — an 80–90% structural reduction that does not require headcount cuts, but does require rethinking what automation means. The ROI is not primarily a labour saving; it is a capacity liberation. This post benchmarks what manufacturers actually report after 12 months of autonomous order processing: per-order cost trajectories, payback periods, error elimination savings, and the revenue capacity unlock that compounds through year two and beyond.
Table of Content
- B2B Order Automation Delivers 80–90% Per-Order Cost Reduction Within 12 Months
- The ROI Has Three Components: Cost Reduction, Error Elimination, and Revenue Capacity
- Payback Period Is Typically 6–12 Months: The First 90 Days Are the Signal
- Beyond Year 1: ROI Compounds as Volume Grows Without Proportional Cost Growth
- Frequently Asked Questions
- What ROI do B2B manufacturers typically achieve from order automation within 12 months?
- How long does it take for B2B order automation to pay back its investment?
- What are the main components of order automation ROI in B2B manufacturing?
- How does B2B order automation ROI compound over time as revenue grows?
- What metrics should B2B distributors track to confirm order automation is delivering expected ROI?
B2B Order Automation Delivers 80–90% Per-Order Cost Reduction Within 12 Months
The Cost Baseline: €15–35 per Order Before Automation
The ROI calculation for B2B order automation begins with the cost baseline. Manual B2B order processing costs €15–35 per order when fully loaded: operator time for intake and interpretation, ERP keying, exception handling, confirmation, and status communication. The high end of that range applies to operations with a high exception rate — and 20–40% of orders trigger at least one exception, each adding 4–8x the base processing time. For a mid-size manufacturer running 500 orders per day at €20 average, that is €10,000 per day in processing cost, or €2.5M annually before accounting for exception-driven spikes. This is the baseline the business case must beat.
The Post-Automation Cost Floor: Below €2 per Order at Scale
Autonomous execution brings per-order cost below €2 at scale. At 500 orders per day, that is €500 per day — an annual processing cost of €125K against the pre-automation €2.5M. The 80–90% cost reduction is structural: it does not require reducing headcount. It means the existing team can process 5–10x the current volume without additional cost. The operations team that was fully consumed by processing 500 orders per day is now free to handle exceptions, manage customer relationships, and support revenue growth. Efficiency gains of this magnitude are repeatable across manufacturing and distribution when the automation is scoped at the intake layer rather than the ERP entry layer.
Each time we added one or two million euros in revenue, we had to add another operator. From a cost perspective, that's an unsustainable way of operating a business.

The ROI Has Three Components: Cost Reduction, Error Elimination, and Revenue Capacity
Cost Reduction: The Direct Per-Order Saving
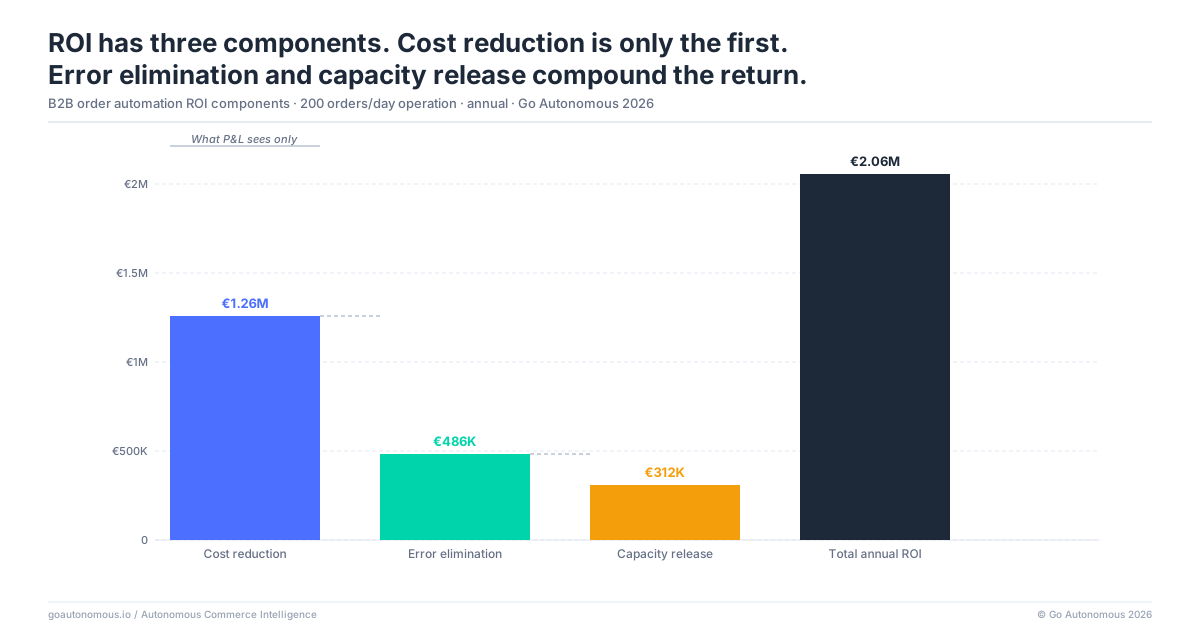
The direct per-order saving is the most visible component of the ROI calculation and the easiest to model before deployment. Take the current average per-order cost, multiply by annual volume, subtract the post-automation cost at the same volume. For most B2B manufacturers, this calculation alone justifies deployment. But it understates the full return, because it captures only the cost of orders that are processed — not the cost of orders that are processed incorrectly.
Error Elimination: The Downstream Cost That Disappears
Manual order processing carries an error rate that generates downstream costs orders of magnitude larger than the initial keying mistake: wrong shipments, return logistics, invoice disputes, customer service escalations, expedited re-shipments to meet original delivery commitments. These downstream costs typically add 30–50% to the total cost savings beyond the direct processing reduction. A manufacturer saving €2.4M annually on per-order cost may find an additional €800K–€1.2M in downstream error elimination. Autonomous processing with AI validation against ERP master data at intake eliminates the source errors before they propagate. The downstream cost does not disappear immediately — it takes one to two order cycles for the pipeline to clear — but it is structurally removed.
Revenue Capacity: The Growth That Becomes Possible Without Operations as a Constraint
The third component is the hardest to quantify in the business case and the most significant in practice. When the operations team can absorb 5x the current order volume without additional headcount, revenue growth stops being constrained by processing capacity. The commercial value of removing that constraint — measured in addressable market, faster customer onboarding, and higher win rates from faster order confirmation — typically exceeds the direct cost savings for growth-oriented manufacturers. Topline growth and margin management become genuinely possible when operations is no longer the binding constraint on revenue scale.
Payback Period Is Typically 6–12 Months: The First 90 Days Are the Signal
What the First 90 Days of Deployment Deliver: Volume, Speed, and Accuracy Metrics
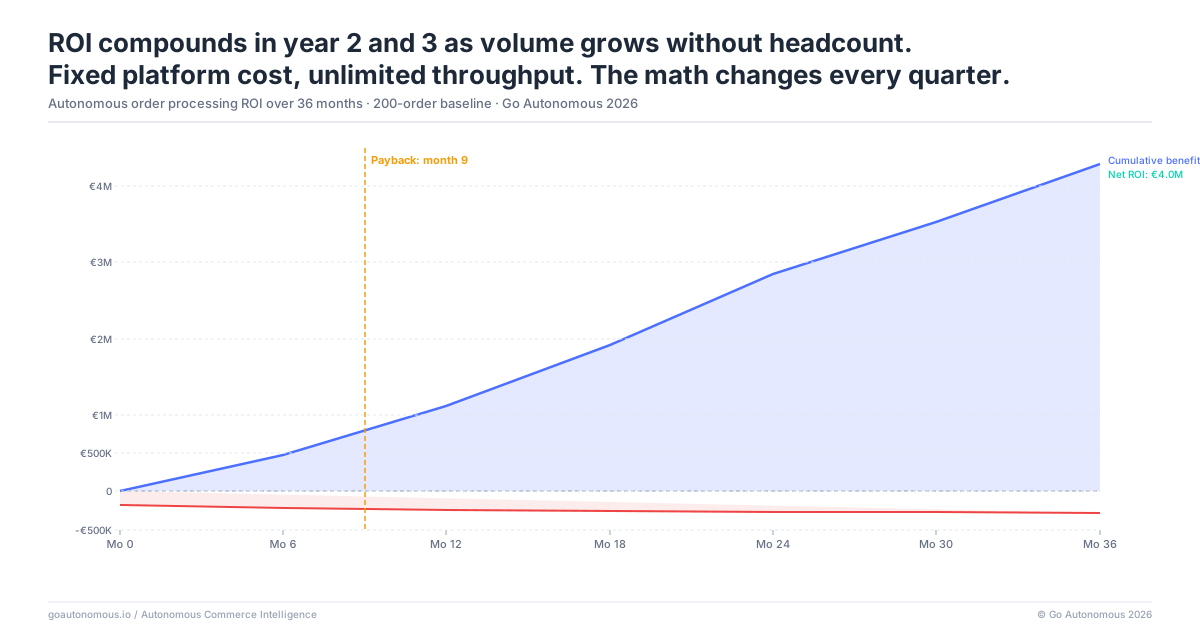
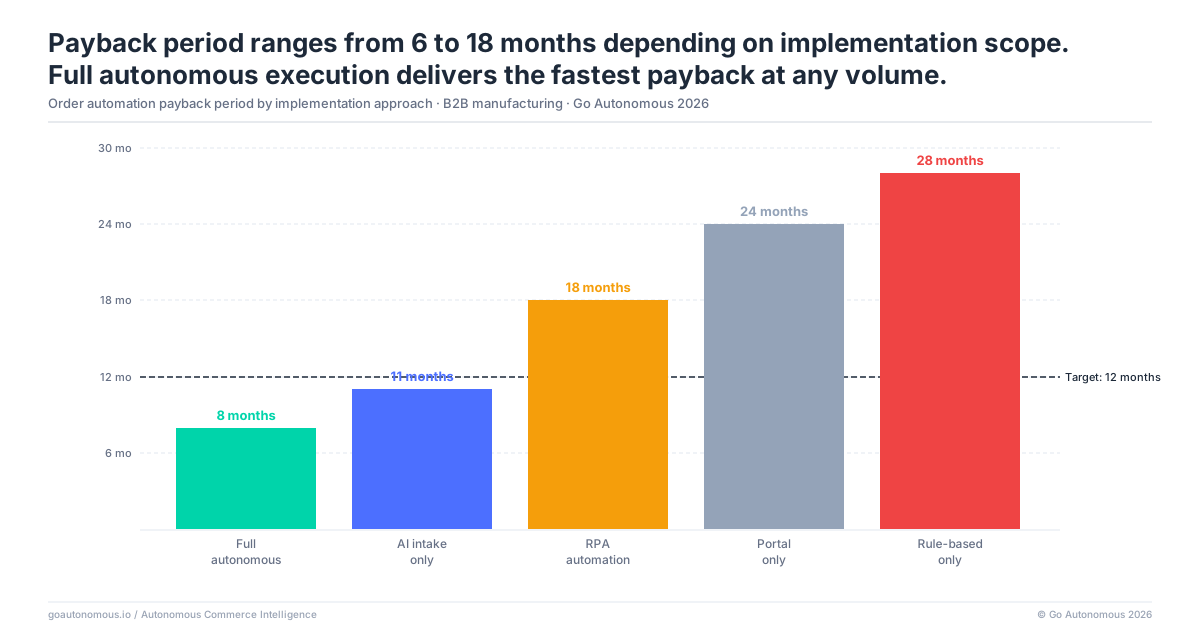
Payback periods for B2B order automation deployments range from 6 to 12 months for most manufacturers, depending on order volume and baseline cost. The first 90 days are the critical signal. By day 90, confirmation times should have dropped substantially — from hours to minutes or seconds. Exception rates should be falling as the AI system learns the order history and builds confidence on edge cases. Per-order cost should be declining in parallel with exception rate reduction. Status inquiry call volume — one of the clearest indicators of customer friction — should be falling as faster confirmation eliminates the information gap that drives inbound calls.
How to Measure Payback: The Metrics That Confirm ROI Is on Track
The four metrics that confirm ROI trajectory in the first quarter are: order confirmation time (should drop immediately from the first week of deployment), exception rate as a percentage of total volume (falls progressively over weeks 4–12 as AI confidence increases), per-order cost (tracks with exception rate reduction), and status inquiry call volume (drops when confirmation time drops, as customers receive faster acknowledgment). Danfoss reduced order processing time from 42 hours to under 1 minute, achieved 80% autonomous processing across 26 countries in a single day of rollout, and the ROI signal in the first quarter was unambiguous. Manufacturers who see these four metrics moving in the right direction by day 90 are on track for 6–12 month payback.
Beyond Year 1: ROI Compounds as Volume Grows Without Proportional Cost Growth
The Year-2 Profile: Revenue Growth Without Operations Headcount Growth
The most significant ROI component for growing manufacturers materializes in year 2 and beyond. Revenue growth that previously required proportional headcount growth now scales without it. Each additional €1M in revenue adds order volume but not processing cost. The operations team sized for €200M in revenue can support €400M without additions. This is the fundamental shift that the Autonomous Commerce model enables: revenue and operations cost are no longer correlated. The CFO’s business case is not just a cost saving in year 1 — it is a structural change in the relationship between revenue growth and operations cost that compounds for as long as the business grows.
What Operations Looks Like at 3x Volume When Processing Cost Is Fixed
The compounding ROI becomes concrete when modelled at specific growth scenarios. A manufacturer growing from €200M to €600M in revenue over three years, with order volume scaling proportionally, would in the pre-automation model require tripling the operations headcount to maintain service levels. With autonomous processing, the same team handles 3x the volume. The incremental headcount cost across three years of growth is zero. VELUX scaled to 130,000+ orders across 9 markets with 88% decision autonomy. Mediq handled 4,000 orders per week with zero headcount increase. These are not outlier outcomes — they are the structural consequence of fixing per-order cost while volume grows. The success cases from manufacturers who have made this transition confirm the pattern consistently.
If you are building the business case for autonomous order processing or evaluating the ROI of a current automation investment, book a session with the Go Autonomous team to model the specific numbers for your operation.
Frequently Asked Questions
What ROI do B2B manufacturers typically achieve from order automation within 12 months?
B2B manufacturers typically achieve 80–90% per-order cost reduction within 12 months of deploying autonomous order processing. Operations running at €20 average per-order cost can reduce that to below €2. The full ROI includes three components: direct per-order cost reduction, downstream error elimination savings (typically adding 30–50% to the direct saving), and revenue capacity unlock as operations can scale without proportional headcount growth.
How long does it take for B2B order automation to pay back its investment?
Payback periods for B2B order automation deployments typically range from 6 to 12 months, depending on order volume and the baseline per-order cost. Higher-volume operations with higher baseline costs tend toward the shorter end of that range. The first 90 days are the leading indicator: if confirmation times have dropped, exception rates are falling, and per-order cost is declining, the trajectory to full payback is predictable.
What are the main components of order automation ROI in B2B manufacturing?
There are three main ROI components in B2B manufacturing order automation. First, direct per-order cost reduction: from €15–35 per manually processed order to below €2 with autonomous execution. Second, error elimination: removing wrong shipments, invoice disputes, and return logistics typically adds 30–50% to the direct cost saving. Third, revenue capacity: when operations can handle 5–10x current volume without additional headcount, revenue growth is no longer constrained by processing capacity.
How does B2B order automation ROI compound over time as revenue grows?
Order automation ROI compounds significantly in year 2 and beyond because the relationship between revenue growth and operations cost is structurally broken. Revenue growth no longer requires proportional headcount growth. A manufacturer growing from €200M to €600M in revenue over three years does not need to triple the operations team. VELUX scaled to 130,000+ orders across 9 markets with 88% decision autonomy as one example of this compounding effect in practice.
What metrics should B2B distributors track to confirm order automation is delivering expected ROI?
B2B distributors should track four key metrics to confirm order automation ROI trajectory: order confirmation time (should drop in the first week of deployment), exception rate as a percentage of total order volume (should fall progressively over weeks 4–12), per-order cost (tracks with exception rate reduction), and status inquiry call volume (should drop as faster confirmation reduces customer uncertainty). If all four are moving in the right direction by day 90, the deployment is on track for 6–12 month payback.