.svg)





Working Capital Released: The B2B Metric That Turns Order Execution Speed into Balance-Sheet Impact
Working Capital Released quantifies the capital unlocked when autonomous order execution compresses the order-to-cash cycle. For B2B manufacturers at scale, each DSO day reduced releases millions in freed cash.
A B2B manufacturer with 500 million euros in annual revenue that compresses its order-to-cash cycle by 5 days releases approximately 6.8 million euros in working capital. By 10 days, 13.7 million. The calculation is not complex. The surprising part is that most operations directors have never run it, because the link between order processing speed and balance sheet position sits in the finance department, not in the order management review.
This post defines Working Capital Released as a metric, explains how autonomous order execution drives it, and gives you the formula to calculate your own exposure.
Table of Content
- What Is Working Capital Released and Why Does Order Execution Speed Determine It?
- How Autonomous Order Execution Compresses DSO Across B2B Manufacturing and Distribution
- How to Calculate Working Capital Released From Your Current Order Cycle
- See How Autonomous Order Execution Releases Working Capital in Your Environment
- The Cost of Standing Still
- Frequently Asked Questions
- What is working capital released in B2B order management?
- How does order processing speed affect DSO for B2B manufacturers?
- How do you calculate working capital released from autonomous order execution?
- What DSO improvement can a B2B manufacturer realistically achieve from autonomous order processing?
- Why does autonomous commerce compress the order-to-cash cycle faster than ERP optimization?
What Is Working Capital Released and Why Does Order Execution Speed Determine It?
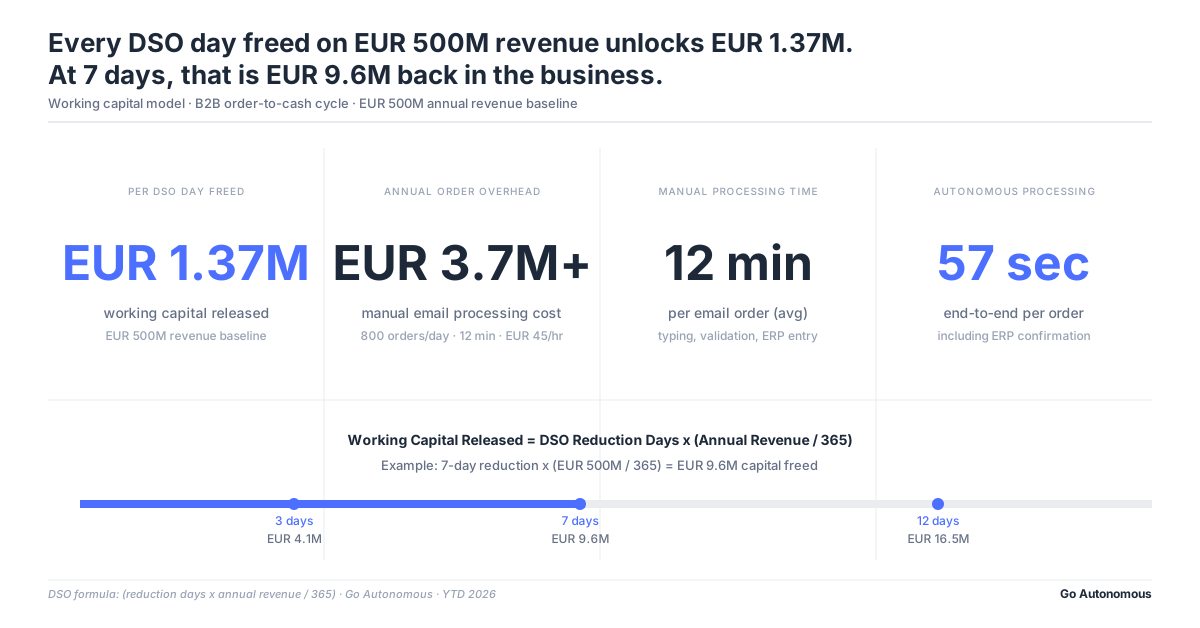
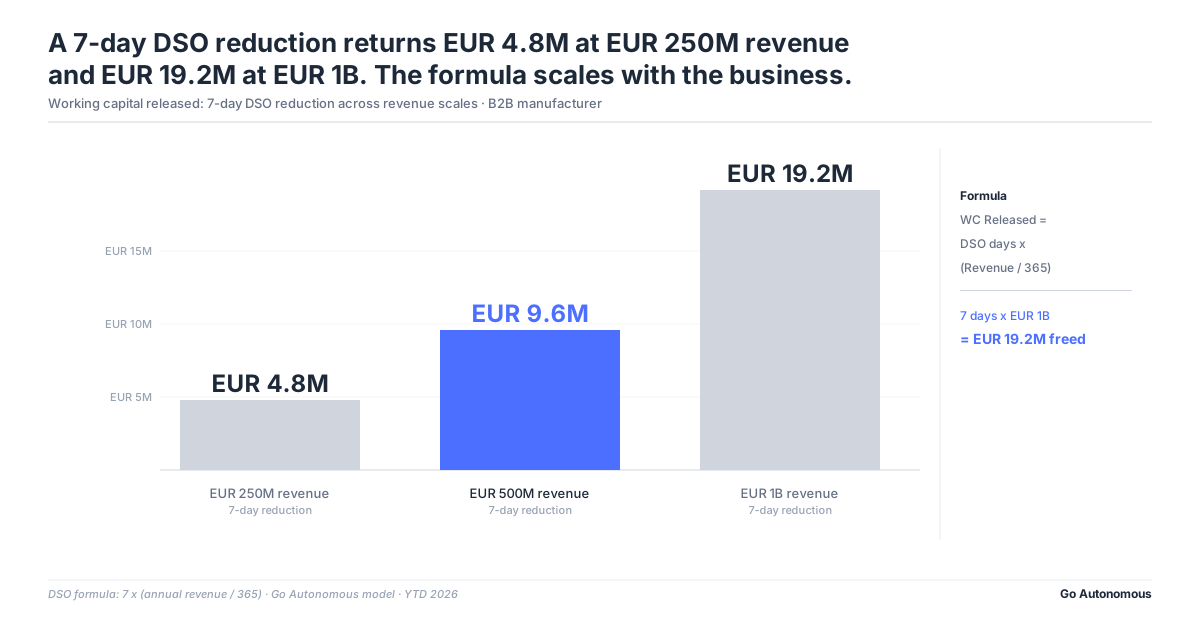
Working Capital Released is the capital unlocked when order-to-cash cycles compress through autonomous execution. It is calculated as: (Old DSO minus New DSO) multiplied by average daily revenue. For a manufacturer with 500M EUR annual revenue, each day of DSO reduction releases approximately 1.37M EUR. For a 1B EUR distributor, approximately 2.74M EUR per day.
DSO, or Days Sales Outstanding, measures how long revenue sits in receivables before it converts to cash. Most DSO conversations in finance focus on collections policy, payment terms, and customer credit risk. Those are real levers. However, a third driver gets far less attention: the time between a customer placing an order and that order being confirmed, processed, and dispatched. Every day of delay in that window extends DSO before the invoice is even raised.
How Does Order Processing Time Affect DSO for B2B Manufacturers?
Order processing time affects DSO directly because the invoice clock does not start until the order is confirmed and fulfilled. A manufacturer processing 800 email orders per day at an average handling time of 12 minutes per order commits 160 person-hours daily to order intake. At peak periods, that backlog extends to 24 or 48 hours before an order is validated. That delay pushes the fulfillment date out, which pushes the invoice date out, which extends receivables by the same margin.
For manufacturers operating across SAP S/4HANA, Oracle Order Management Cloud, or Microsoft Dynamics 365, the ERP validates and records the order accurately. It does not read the email, extract the line items, or resolve the pricing discrepancy in the attached spreadsheet. That gap between channel receipt and ERP entry is where DSO extension begins. For distributors processing high volumes of blanket PO call-offs alongside one-off email orders, the variability is compounded across order types.
Why Do Traditional DSO Improvement Programs Miss the Execution Layer?
Traditional DSO improvement programs focus on three areas: tightening payment terms, accelerating collections follow-up, and improving invoice accuracy to reduce disputes. All three are valid. None of them address the order processing delay that stretches the cycle before the invoice exists. Finance teams measuring DSO from invoice date rather than order receipt date systematically underreport the true order-to-cash cycle. Autonomous order execution compresses the window that traditional DSO programs cannot see.
According to APQC benchmarking on accounts receivable and DSO, top-quartile manufacturers achieve DSO figures significantly below their sector median. The gap between top quartile and median performance is not explained by payment terms alone. Processing speed at the order intake layer is a material contributor that most benchmarking frameworks do not isolate.
How Autonomous Order Execution Compresses DSO Across B2B Manufacturing and Distribution
Autonomous execution removes the human latency between order receipt and order confirmation. When the Autonomous Commerce platform processes an incoming order, it reads the channel (email, EDI 850, portal submission, or unstructured document), extracts the commercial intent, validates against the pricing master and inventory availability, and writes the confirmed order to the ERP. Standard orders complete this in under 60 seconds. The invoice clock starts within minutes of the customer submitting the order, not hours or days later.
For manufacturers with complex pricing structures, tiered contract terms across customer segments, or multi-country operations requiring regional pricing policy, the autonomous execution layer embeds those rules directly. Exceptions route to human operators with full context pre-populated. The operator decides. The system executes. The exception handling that previously blocked order queues resolves in minutes rather than waiting for the next available shift.
Each time we added one or two million euros in revenue, we had to add another operator. From a cost perspective, that's an unsustainable way of operating a business.

The headcount ceiling Mikkel Diness Vindeløv describes at Hempel is a direct consequence of human-dependent order execution. Each incremental revenue increase requires a proportional increase in processing capacity. That scaling model does not compress DSO. It maintains DSO at whatever level the team size can sustain. Autonomous execution breaks the ratio. Volume scales without headcount growth, and processing speed stays constant regardless of peak demand.
What DSO Improvement Can B2B Manufacturers Realistically Achieve From Autonomous Order Processing?
DSO improvement from autonomous order processing depends on the starting state of manual execution. Manufacturers where order intake is predominantly email-based with high exception rates can compress processing time from 24 to 48 hours to under 30 minutes for standard orders. At 500M EUR revenue, that alone compresses DSO by 1 to 2 days in the processing window. Combined with reduced invoice error rates from clean autonomous extraction, total DSO improvement of 5 to 12 days is achievable within the first year of full deployment.
The DSO improvement from autonomous execution compounds with data quality. When the platform reads and structures every order consistently, pricing discrepancies surface at intake rather than at invoice dispute. The CFO’s AI Mandate white paper from Go Autonomous addresses this directly: invoice accuracy rates above 98% eliminate the dispute cycle that extends receivables by 7 to 14 days in manufacturing operations with complex pricing structures. Read The CFO’s AI Mandate for the full financial case.
The data foundation enabling this DSO compression deserves specific attention. Clean master data on pricing, customer entitlements, and product configurations is the prerequisite for autonomous execution at high accuracy rates. Organizations that treat master data quality as a precondition for deployment rather than a parallel workstream see the fastest DSO movement.
AI-driven automation serves as a powerful motivator for process optimization. With immediate and tangible results that are transparent to all stakeholders, the impact of master data cleanup and enrichment is unmistakable.
The pattern Olga Chernyakova Poulsen describes at Grundfos is consistent across deployments: autonomous execution creates an immediate feedback loop on data quality because the system surfaces every ambiguity it cannot resolve autonomously. That visibility is operationally productive. It converts vague master data debt into specific fixable line items, which in turn expands the autonomous execution coverage rate and further compresses DSO.
Customer outcomes across Go Autonomous deployments reflect this arc: manufacturers who treat master data as phase one see their autonomous execution coverage rate expand significantly faster than those who treat it as a parallel cleanup project. For more on the operational efficiency impact of autonomous execution, see our outcomes overview.
Why Does Autonomous Commerce Compress the Order-to-Cash Cycle Faster Than ERP Optimization?
ERP optimization improves what happens inside the ERP: validation rules, workflow routing, approval hierarchies, and reporting. It does not address the time between an order arriving in any channel and being entered into the ERP. That gap, from channel receipt to ERP entry, is where 60 to 80 percent of order handling cost and DSO extension live in email-heavy B2B operations. Autonomous execution operates in that gap. It is not an ERP feature. It is the execution layer that sits between commercial intent and ERP record.
Rules-based automation tools, including RPA platforms such as UiPath and Blue Prism, address structured and predictable inputs within that gap. They handle EDI-formatted orders reliably. They do not handle the unstructured email with a PDF attachment, the order that references a product code that has been superseded, or the customer who submits a quantity that conflicts with their contract tier. Those cases require judgment. Autonomous Commerce applies AI-based reasoning to resolve them, or routes to a human operator when the confidence threshold is not met. The Human Dependency Ratio drops measurably as the exception resolution rate increases.
How to Calculate Working Capital Released From Your Current Order Cycle
The calculation requires three inputs: your current DSO, your projected post-deployment DSO, and your average daily revenue. Every finance team already has the first and third. The second requires an honest audit of where your order-to-cash cycle loses time today.
- Calculate your current DSO. Divide total accounts receivable by average daily revenue (annual revenue divided by 365). This is your baseline.
- Identify your processing delay contribution. Measure average time from order receipt to ERP entry. For email-heavy operations, 12 to 48 hours is common. Convert to DSO-equivalent days.
- Estimate your autonomous execution DSO target. Standard structured orders process in under 30 minutes. Complex exception orders resolve within 2 hours. Set a conservative post-deployment target based on your order mix.
- Apply the formula. (Old DSO minus New DSO) multiplied by average daily revenue. The result is your Working Capital Released figure.
- Project the full balance sheet impact. Include invoice accuracy improvement (fewer disputes extending receivables) and exception resolution speed alongside processing time compression.
To illustrate: a manufacturer at 750M EUR annual revenue with a current DSO of 45 days and a post-deployment DSO target of 37 days is looking at 8 days of compression. Average daily revenue: 2.05M EUR. Working Capital Released: 16.4M EUR. That is not an operational efficiency number. That is a balance sheet number, relevant to the CFO, the treasury function, and the board.
What Does the Progression Look Like Across Deployment Stages?
Working Capital Released does not arrive in a single step. It accumulates as autonomous execution coverage expands from structured EDI and portal orders to unstructured email and complex exception handling. The table below shows the capital release progression across a typical deployment arc at a 500M EUR revenue base.
| DSO Compression Stage | Capital Released (500M EUR base) | What Autonomous Execution Is Delivering | When to Push Further |
|---|---|---|---|
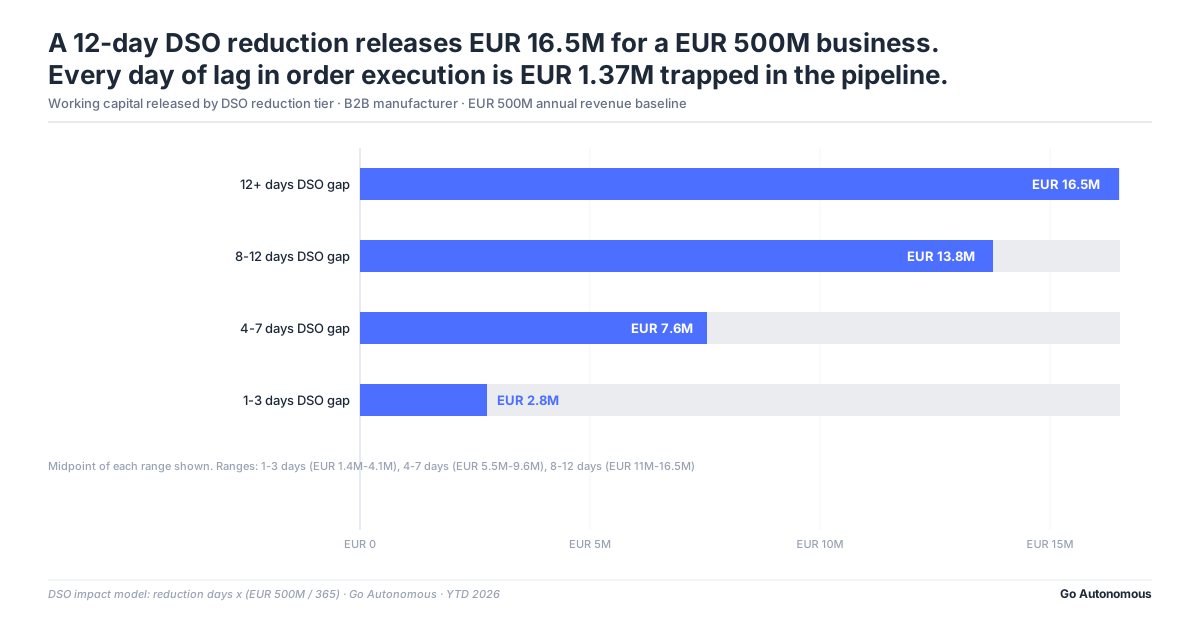
| 1 to 3 days | 1.4M to 4.1M EUR | Straight-through processing on standard structured orders; email still manual | When touchless rate exceeds 60% |
| 4 to 7 days | 5.5M to 9.6M EUR | Autonomous intake across EDI, portal, and structured email; exceptions partially resolved | When exception rate falls below 20% |
| 8 to 12 days | 11M to 16.5M EUR | End-to-end autonomous execution including unstructured email and exception resolution | When DSO improvement starts to plateau |
| 12+ days | 16.5M+ EUR | Full autonomous commerce deployment with pricing policy embedded | Ongoing: optimize contract terms and master data |
Two deployments illustrate this progression in practice. At Danfoss, the shift to autonomous order processing reduced order processing time from 42 hours to under 1 minute, with 80% of decisions made autonomously across 26 countries. The DSO compression enabled by that speed shift, combined with near-elimination of manual pricing errors, translates directly into the Working Capital Released formula. See the full Danfoss case study for outcome details.
At Mediq, autonomous processing handles 4,000 orders per week with 75% faster processing and zero headcount increase. For a distributor operating on tight margins with high order volume, processing speed is the primary lever on DSO and therefore on working capital position. See the Mediq case study for the distribution sector outcomes. For the broader context on topline growth and margin management enabled by autonomous execution, the Go Autonomous platform overview covers the commercial framework.
See How Autonomous Order Execution Releases Working Capital in Your Environment
If you have run the Working Capital Released calculation against your current DSO and order processing times, the next step is understanding what your specific deployment arc looks like. The compressible window in your order-to-cash cycle depends on your channel mix (email proportion, EDI coverage, portal adoption), your exception rate, and your pricing complexity. Those variables determine how quickly DSO moves and at what deployment stage the largest capital releases occur. Go Autonomous works with 500M to 20B EUR manufacturers and distributors in the Nordics, DACH, Benelux, UKI, and France. If the patterns described in this post apply to your operations, we can show you exactly what autonomous execution looks like in your environment: your ERP, your order channels, and your commercial workflows. Book a conversation with our team.
The Cost of Standing Still
For a 500M EUR manufacturer currently processing orders manually with a DSO 8 to 12 days above the autonomous execution baseline, the annual cost of standing still looks like this:
- Working capital locked in slow receivables: 11M to 16.5M EUR sitting in the order-to-cash cycle that autonomous execution would release. That capital is currently financing the delay, not the business.
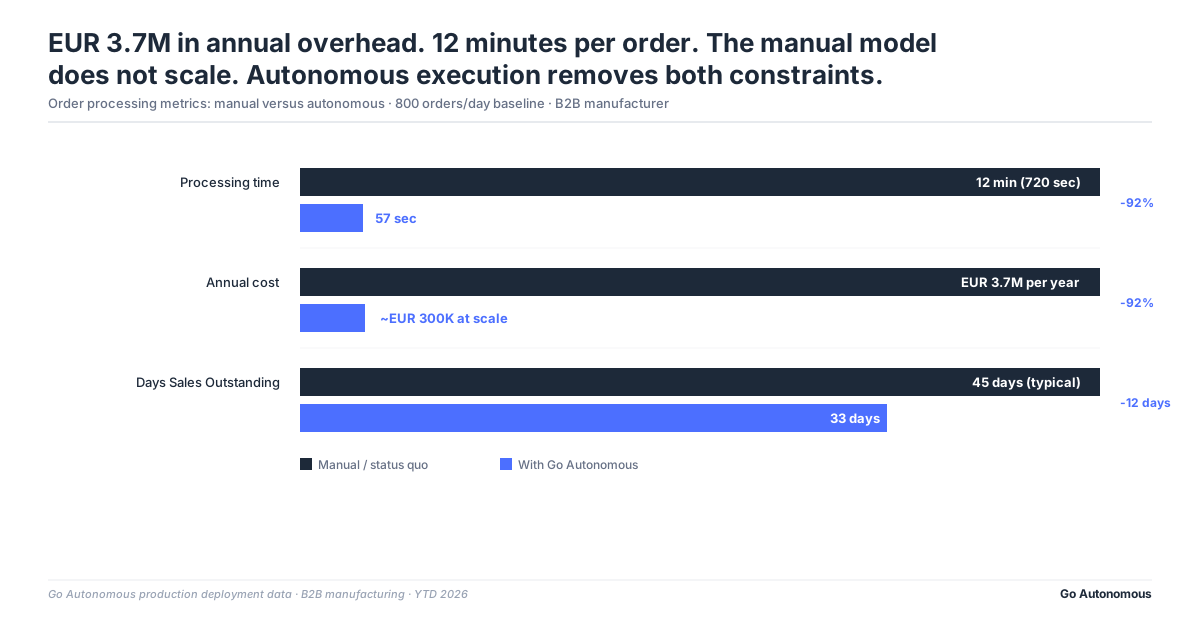
- Processing overhead: At 800 email orders per day with 12-minute average handling time, approximately 1,600 person-hours per week committed to execution that generates no commercial value. At a fully-loaded cost of 45 EUR per hour, that is over 3.7M EUR annually.
- Headcount scaling cost: Each incremental revenue increase requires proportional headcount increase to maintain processing capacity. The Human Dependency Ratio does not improve. It compounds. Revenue at 10% annual growth means the processing team must also grow to keep DSO flat.
- Invoice dispute cycle cost: Manual data extraction from unstructured orders produces pricing mismatches and quantity errors at rates that extend DSO by 7 to 14 days in complex pricing environments. Each dispute cycle adds cost-to-serve and delays cash conversion.
The total picture: a manufacturer at 500M EUR revenue sitting 10 days above the autonomous execution DSO baseline is carrying 13.7M EUR in avoidable working capital exposure, spending over 3.7M EUR annually on processing overhead, and scaling headcount in proportion to revenue growth. Each year without action is another year that capital is unavailable for investment, acquisition, or debt reduction. The formula does not change. The exposure accumulates.
Sources
- APQC: Accounts Receivable and DSO Benchmarks
- Go Autonomous: Danfoss Case Study
- Go Autonomous: Mediq Case Study
Frequently Asked Questions
What is working capital released in B2B order management?
Working Capital Released is the capital unlocked when order-to-cash cycles compress through faster order execution. It is calculated as (Old DSO minus New DSO) multiplied by average daily revenue. For a 500M EUR manufacturer, each day of DSO reduction releases approximately 1.37M EUR from receivables into available cash.
How does order processing speed affect DSO for B2B manufacturers?
Order processing speed affects DSO because the invoice clock does not start until the order is confirmed and fulfilled. Delays between order receipt and ERP entry, common in email-heavy B2B operations, push fulfillment dates out and extend receivables before the invoice is raised. Reducing processing time from 24 hours to under 30 minutes compresses DSO by 1 to 2 days at the intake stage alone.
How do you calculate working capital released from autonomous order execution?
Subtract your post-deployment DSO target from your current DSO to get the compression in days. Multiply that figure by your average daily revenue (annual revenue divided by 365). The result is your Working Capital Released. For a 750M EUR manufacturer compressing DSO by 8 days, the calculation yields approximately 16.4M EUR released.
What DSO improvement can a B2B manufacturer realistically achieve from autonomous order processing?
For manufacturers with predominantly email-based order intake and high exception rates, autonomous execution typically delivers 5 to 12 days of DSO compression within the first year of full deployment. The improvement comes from three sources: faster processing reducing pre-invoice delay, higher invoice accuracy reducing dispute-driven extensions, and faster exception resolution reducing order holds.
Why does autonomous commerce compress the order-to-cash cycle faster than ERP optimization?
ERP optimization improves what happens inside the ERP system. It does not address the time between order arrival in any channel and ERP entry. That gap, from channel receipt to ERP record, is where 60 to 80 percent of order handling cost and DSO extension live in email-heavy B2B operations. Autonomous Commerce operates in that gap by reading, extracting, validating, and routing orders without human intervention at each step.